I've been a very late adopter of Docker containers. Probably because most of my work in the last years was not dependent on the PHP version, so I used the same PHP version and MySQL/MariaDB as RDBMS every time. For a server I managed I played with LXC as a container system, and served quite well, but I didn't really need to touch it often, and my friend Andrés helped most of the times. Docker seemed confusing to me and, hold my beer, I thought it wouldn't stay, so I didn't really want to learn it. You might say now that my career as seer is over.
Not easily but I got to understand it, and really embraced and loved tools like docker-compose on top of docker. And when I had to work on a Drupal site using Postgres, my best bet was DDEV, abstracting docker-compose complexities but with all the freedom to customize it for your needs. So that's my platform of choice most of the times in terms of local environments now. And lucky us, it's open source.
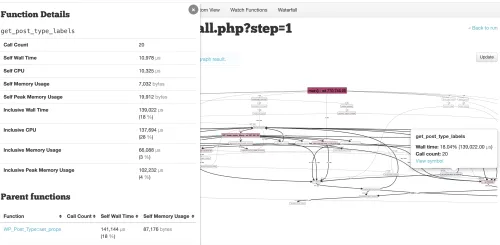
And the implicit non-enforced well-citizen contract of opensource is that you have to contribute back if you get the chance to improve it*. In minor contributions I've done before I found the DDEV community really encouraging and welcoming, thanks Randy! So lately I was in the need of detecting performance bottlenecks in a site, and I've been working on integrating the provided XHProf with XHGui into DDEV. I recently contributed the recipe so you can use it too in less than 5 minutes! See it here: XHGui integration in DDEV documentation.
* Needed clarification: not saying that you have to give back, not everyone has the same privilege than I do. But *if you did accomplish it already, try to contribute it*.
If you enable XHProf, already provided with DDEV, it already monitors your application, but you need to collect that profiling report and send it somewhere where you can explore it in a friendly way. That's where perftools/php-profiler comes into play. It has the ability to manage which data you want to profile, and send it to XHGui. XHGui will run on a separate container, will receive the data profiled, store the data in a mongodb database in another container, and render it to you on the browser, where you can see several listings, graphs and images that will help you understand what's going on on your application. You can also compare different requests to a same page, so you see how the performance evolves too. Interpretation of that data is a complex topic on its own, so I won't go deeper here.
So the good news is that you can integrate that now into any project you have with DDEV, in less than 5 minutes. The docs are specific for Drupal 8+ (a composer project) and WordPress (a non-composer project, kudos to roots/bedrock for changing that), so that probably covers examples for any PHP application out there. Hope this helps!
As a bonus track, I also worked on a DDEV command for enabling/disabling xhprof without having to restart your project, type a very long command or ssh into the container. That's on that DDEV-contrib page too, but it's probably going to be accepted upstream in DDEV soon too.
Thanks Randy "rfay" Fay, Andrey "andypost" Postnikov and Mateu "e0ipso" Aguiló for the feedback, help and inspiration on working on this!
